We have just released the initial version (2021.1) of the Z1 Designer. This new application allows users of the Z1 Dashboard to create their own dashboards. Once created, if you share your designs any other user of the Z1 Dashboard can use the design as well.
The Z1 Designer is a free application and can be downloaded here:
https://z1simwheel.com/dashboard/demo.cfm
-- THE BASICS
The Z1 Designer lets you create your own dashboards for use with the Z1 Dashboard. A dashboard created in the Z1 Designer requires the same version or higher of the Z1 Dashboard to run. So dashboards created in version 2021.1 of the Z1 Designer will need version 2021.1 or higher of the Z1 Dashboard to run.
Each dashboard currently consists of two files - an XML definition file and a PNG preview image file. Both of these files are placed inside a single folder. This folder should have the same name as the Dashboard. So if you name your dashboard 'My Dashboard', then the folder containing that dashboard's files will be called 'My Dashboard'. The Z1 Designer will create these files and folder automatically when you create a new dashboard.
For a custom dashboard to be available to the Z1 Dashboard its folder should be placed inside the 'Dashboards' folder located inside documents/Z1Dashboard. So with our above example called 'My Dashboard' the folder structure would be 'documents/z1dashboard/dashboards/my dashboard'. The Z1 Designer will place any newly created Dashboards in this location by default.
All custom dashboards available to the Z1 Dashboard will be displayed at the bottom of the Car 2 tab's dashboard drop down.
-- CREATING NEW DASHBOARDS / OPENING DASHBOARDS
After starting the Z1 Designer you need to either Create a new dashboard (File->New Dashboard), or open an previously created dashboard (File->Open Dashboard). There is a sample dashboard provided with version 2021.1 of the Z1 Dashboard. To open this sample dashboard (or any other dashboard) you need to select the 'Dashboard' XML file within its containing folder. To open the sample dashboard select the Dashboard XML file located in 'documents/z1dashboard/dashboards/Sample Dashboard'.
-- DASHBOARD LAYOUT
All dashboards are separated into two main layers: Background and Foreground. The Background layer is drawn once when the dashboard is created. The Foreground layer is drawn every time the Z1 Dashboard redraws. You should place objects in the appropriate layer when creating your dashboards. Objects that do not change should be placed in the background. Objects that could change (such as data channels, shift lights, warnings, etc) should be placed in the foreground.
-- Z1 DESIGNER WINDOWS
There are 7 windows within the Z1 Designer that you will use to create your dashboard. They are explained below.
You can move any window by dragging its title bar. You can resize any window by dragging its lower right corner. All windows have a minimum size, which they can't be resized below. The Dashboard Properties, Dashboard Defaults and Dashboard Shift Lights windows can be closed by clicking on the X in the top right corner. The other windows cannot be closed. You can display any window by choosing it from the 'Windows' main menu.
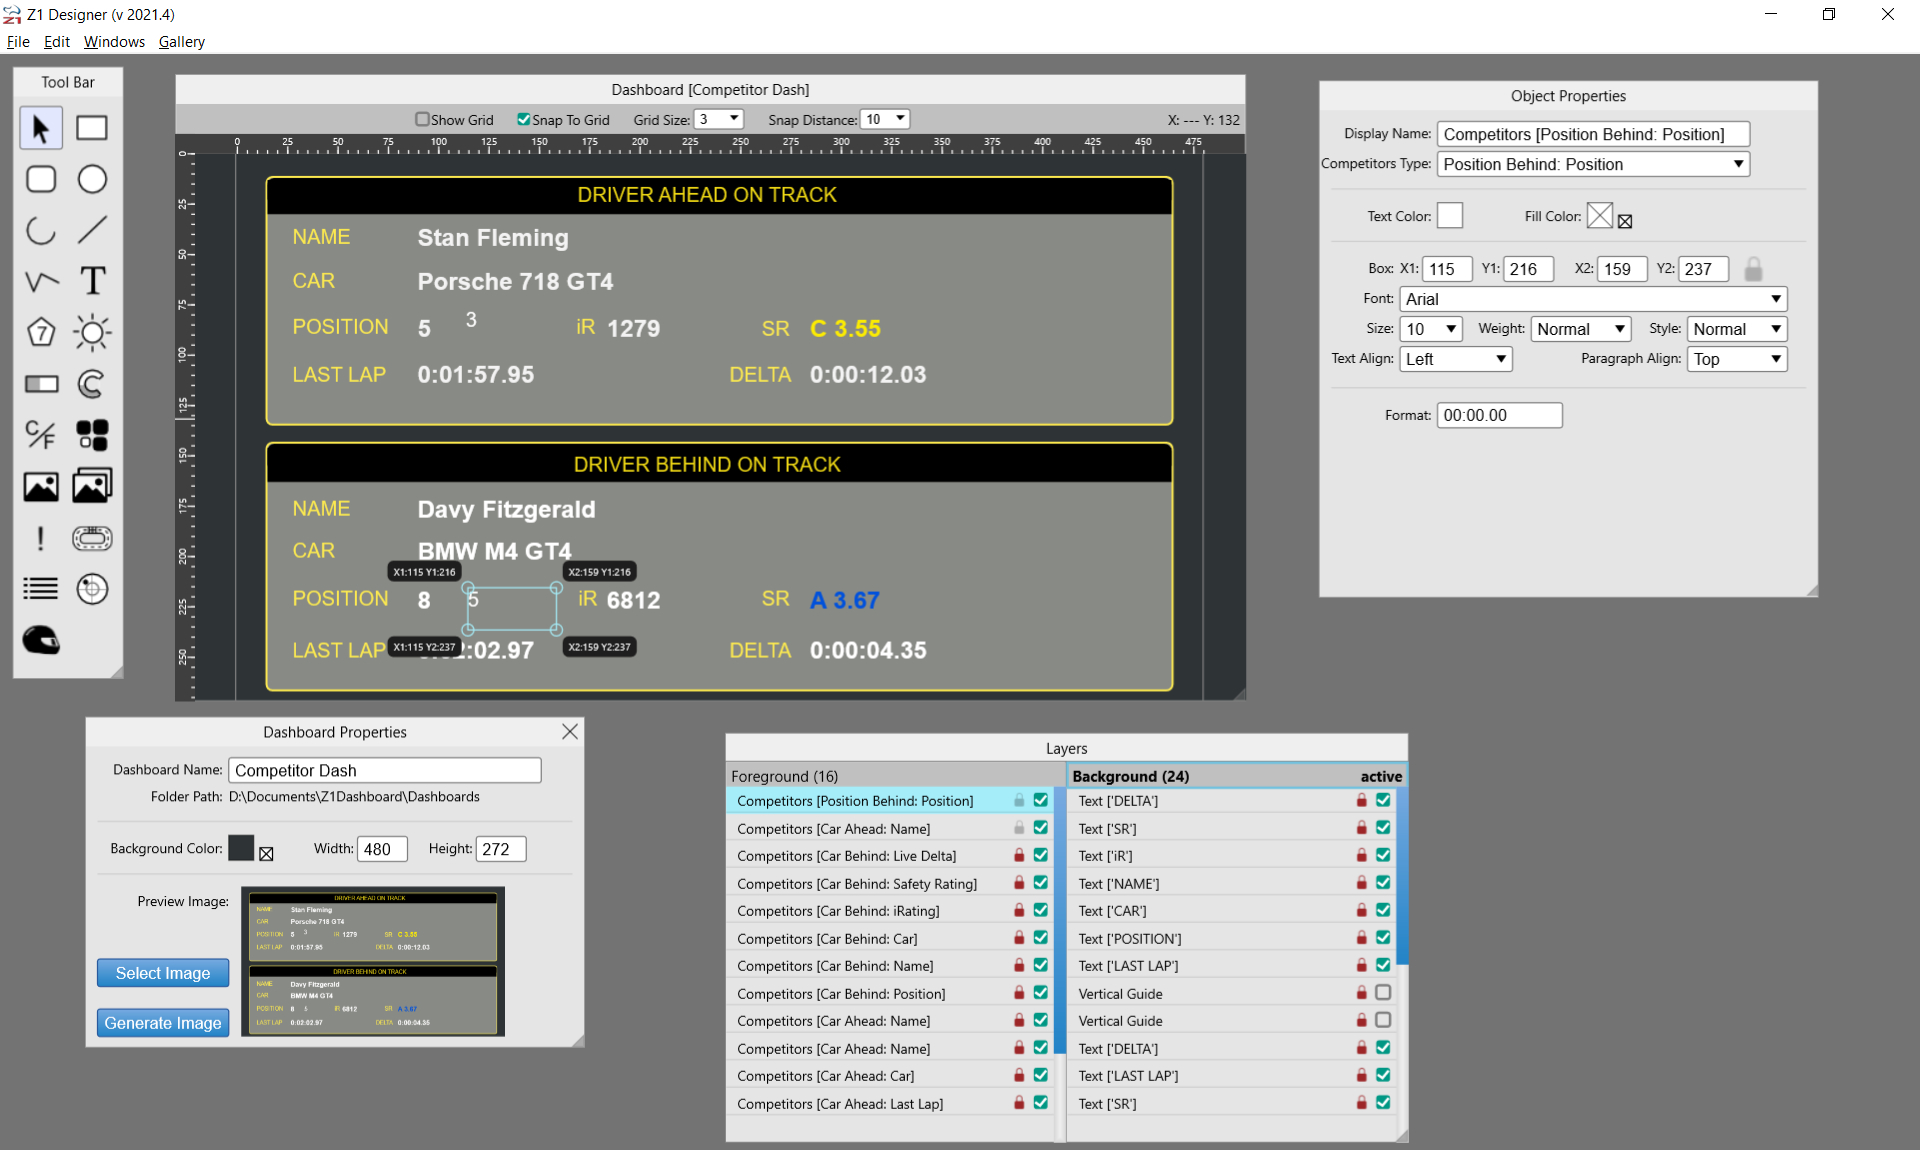
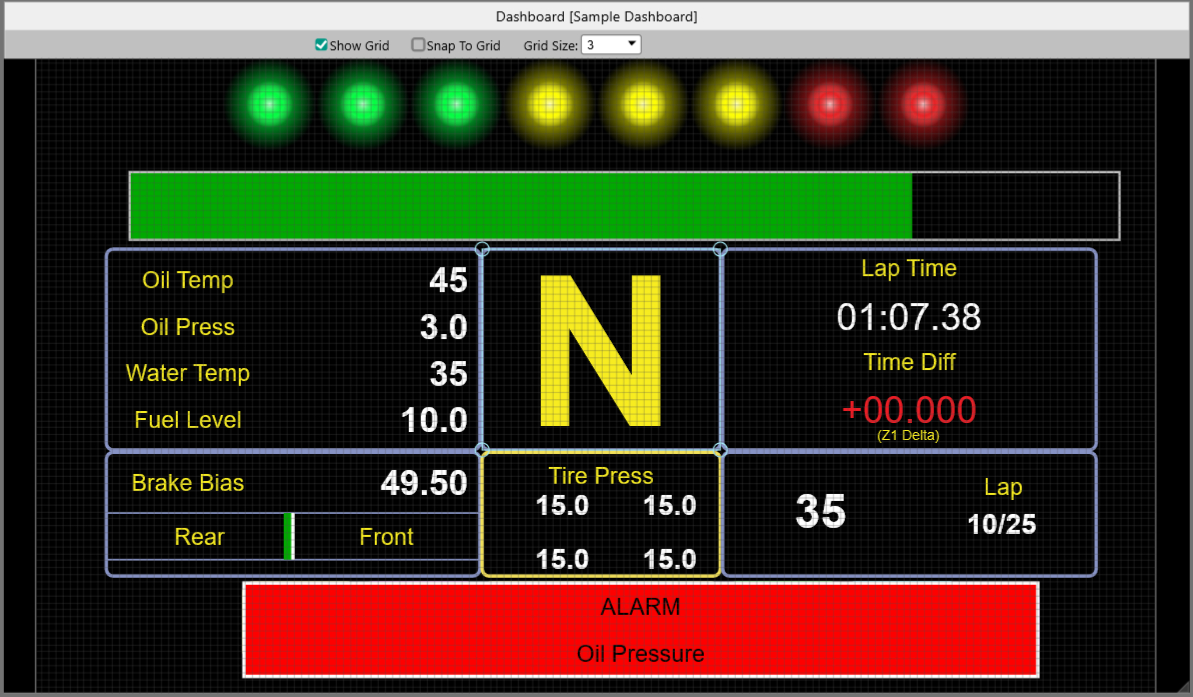
-- DASHBOARD WINDOW
This is where your dashboard design is displayed. The dashboard is displayed here exactly as it will appear within the Z1 Dashboard. Resizing this window has the same effect as resizing the Z1 Dashboard. This allows you to see what your Dashboard will look like at different resolutions.
-- TOOL BAR WINDOW
This window displays all available tools. The pointer tool lets you select an object, move it, or resize it. To select an object simply click on it with the pointer. If multiple objects are located in the same place then the one which is 'on top' will be selected. Once an object is selected you can move it by clicking on it and dragging it to the desired location. You can resize a selected object by clicking and dragging on of the displayed resize handles. (To select objects that are underneath other objects, select that object's name in the Layers window.)
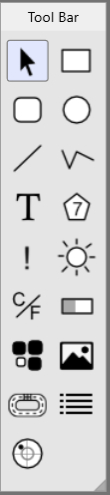
The other tools let you add various objects to your dashboard. If you hover the mouse over a tool its function will be displayed. The currently available objects to be added are: Rectangle, Rounded rectangle, Ellipse, Line, Multi-Line, Text, Data channel, Warning, Shift Light, Units, Graph, and Widget. Any newly created object will be placed in the currently active layer. (See the Layer Window section for more information.)
To add any object, select the tool, then click on the Dashboard where you want the object to appear and drag to the right and down to expand the size of the object. It does not matter if you get the size and placement exactly correct as you can move and resize the object at any time. The multi-line tool will add a new line segment every time you use the left mouse button. To end the multi-line object double click the mouse.
'Data Channel' - this displays a specific car data channel, such as gear, RPM, oil temp, etc. Note that data channels associated with user selectable units, like temperatures, will be displayed in the units specified by the user of the Z1 Dashboard when run in the Z1 Dashboard.
'Units' let you display certain units, such as temperature, in the units selected by the user of the Z1 Dashboard. So if you place a units object that is defined to show temperature, it will show 'C' if the user displays temperature in metric units, and 'F' if the user displays them in imperial units.
'Text' - This lets you define a rectangle within which you can display text. Once you create the text rectangle, use the Object Properties window to specify the text to be displayed.
'LED' - This lets you place an LED. There can be up to 15 shift light LEDs and 6 warning LEDs. Each LED can have its own On and Off colors. There is a checkbox within the Shift Lights Properties window that lets you turn the LED on or off to see what it looks like on both configurations. Note this setting has no effect on the Z1 Dashboard, it is only for designing purposes within the Z1 Designer.
'Graph' - This lets you display a data channel as a graph. This is useful for displaying rev counter bars, or brake bias bars, etc. You specify the direction the bar should move in (left to right, right to left, etc). You also specify the data channel associated with it and the minimum and maximum values for that channel.
A 'Warning' object lets you group objects together that are only displayed if the warning criteria is met. For example the pit limiter, or a high oil temperature. A warning object can contain any other type of object except another warning object.
'Widget' - This lets you display various items, or widgets, on your dashboard. Example of these are the lap time, delta time, lap counter, etc.
We suggest playing around with these various tools to see what they do.
-- LAYERS WINDOW
This displays all the objects contained on the background and foreground layers. You can use the scroll bar to move up or down the list if necessary. As mentioned before objects that never change can be placed in the background layer. Objects that could change should be placed in the foreground layer. To set the background as the active layer, click 'Background' in the layers window. To set the foreground as the active layer, click 'Foreground' in the layers window. The currently active layer will be highlighted and have the word 'active' displayed in its header. All new objects are placed on to the currently active layer (either background or foreground).
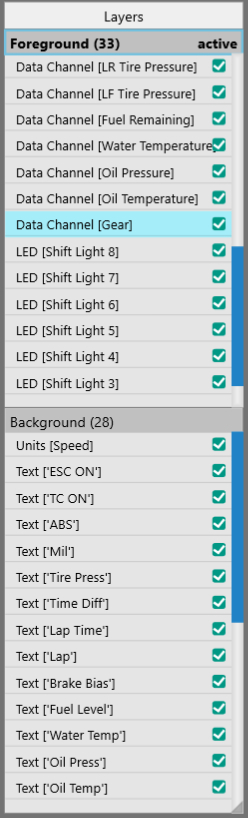
If you click on the name of an object in the layers window that object will become selected. This allows you to interact with, move and resize objects that are underneath other objects.
The checkboxes on the right side of the layers window allow you to toggle the display of an object on or off. This is intended to make designing your dashboard easier. You may have objects, such as warnings, that you do not need to see all the time when designing your dashboard. Or you may just want to temporarily hide some objects to make it easier to work with other objects. Note the hidden/visible status of an object has no effect on how it is displayed within the Z1 Dashboard.
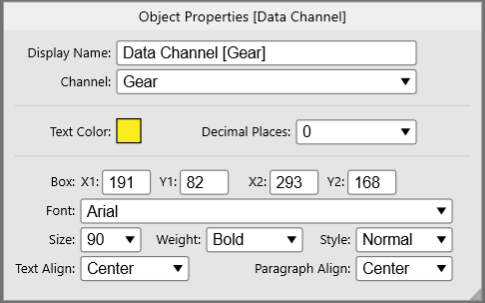
-- OBJECT PROPERTIES WINDOW
This window displays the properties for the currently selected object in the Dashboard window. The display will change based on what type of object is selected. You can make changes to the currently selected object here as desired.
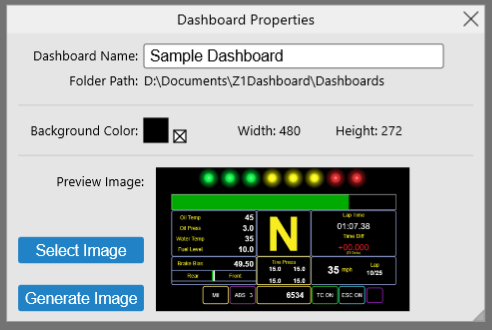
-- DASHBOARD PROPERTIES WINDOW
This window displays high level dashboard properties. You can change the dashboard's name, background color and preview image here. The preview image is what gets displayed in the Z1 Dashboard in the Car 2 tab when the user is selecting a dashboard.
-- DASHBOARD SHIFT LIGHTS WINDOW
This window displays the options for setting when the shift lights illuminate within your dashboard. If your dashboard does not contain shift lights then you can ignore this window. You can either enter specific RPMs for each shift light illumination, or select an option for them to be automatically turned on at certain RPM values. The drop down on the top right lets you choose this. (Note a user of your dashboard can always override these options. What you are entering here is just the default options for your dashboard's shift lights.)
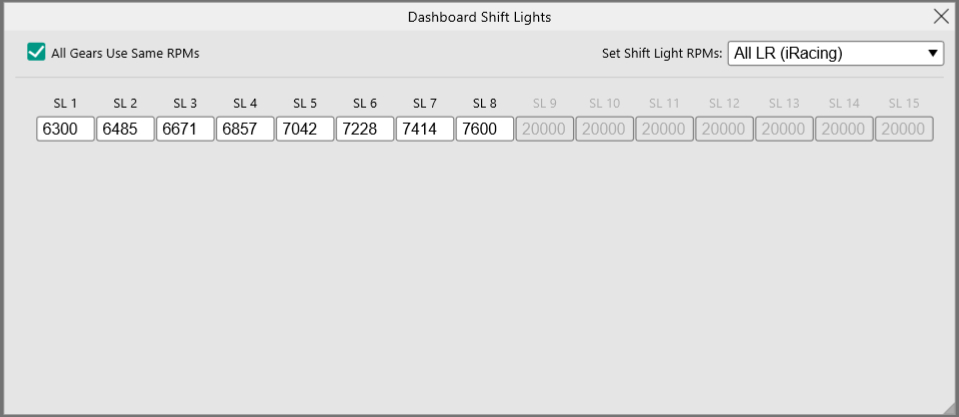
All gears can use the same RPM shift values, or you can specify unique shift values for each gear. There is a checkbox at the top left that lets you toggle this feature on/off.
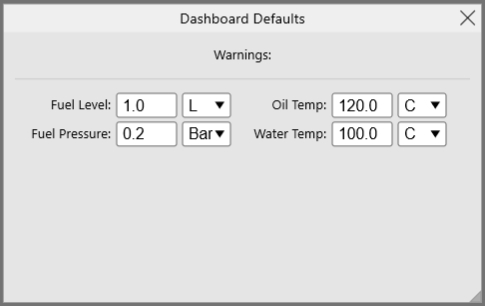
-- DASHBOARD DEFAULTS
This window shows various default values that are used when creating the dashboard. The end user on the Z1 Dashboard can adjust these values if they choose.
The Z1 Designer is a free application and can be downloaded here:
https://z1simwheel.com/dashboard/demo.cfm
The Z1 Designer is a free application and can be downloaded here:
https://z1simwheel.com/dashboard/demo.cfm
-- THE BASICS
The Z1 Designer lets you create your own dashboards for use with the Z1 Dashboard. A dashboard created in the Z1 Designer requires the same version or higher of the Z1 Dashboard to run. So dashboards created in version 2021.1 of the Z1 Designer will need version 2021.1 or higher of the Z1 Dashboard to run.
Each dashboard currently consists of two files - an XML definition file and a PNG preview image file. Both of these files are placed inside a single folder. This folder should have the same name as the Dashboard. So if you name your dashboard 'My Dashboard', then the folder containing that dashboard's files will be called 'My Dashboard'. The Z1 Designer will create these files and folder automatically when you create a new dashboard.
For a custom dashboard to be available to the Z1 Dashboard its folder should be placed inside the 'Dashboards' folder located inside documents/Z1Dashboard. So with our above example called 'My Dashboard' the folder structure would be 'documents/z1dashboard/dashboards/my dashboard'. The Z1 Designer will place any newly created Dashboards in this location by default.
All custom dashboards available to the Z1 Dashboard will be displayed at the bottom of the Car 2 tab's dashboard drop down.
-- CREATING NEW DASHBOARDS / OPENING DASHBOARDS
After starting the Z1 Designer you need to either Create a new dashboard (File->New Dashboard), or open an previously created dashboard (File->Open Dashboard). There is a sample dashboard provided with version 2021.1 of the Z1 Dashboard. To open this sample dashboard (or any other dashboard) you need to select the 'Dashboard' XML file within its containing folder. To open the sample dashboard select the Dashboard XML file located in 'documents/z1dashboard/dashboards/Sample Dashboard'.
-- DASHBOARD LAYOUT
All dashboards are separated into two main layers: Background and Foreground. The Background layer is drawn once when the dashboard is created. The Foreground layer is drawn every time the Z1 Dashboard redraws. You should place objects in the appropriate layer when creating your dashboards. Objects that do not change should be placed in the background. Objects that could change (such as data channels, shift lights, warnings, etc) should be placed in the foreground.
-- Z1 DESIGNER WINDOWS
There are 7 windows within the Z1 Designer that you will use to create your dashboard. They are explained below.
You can move any window by dragging its title bar. You can resize any window by dragging its lower right corner. All windows have a minimum size, which they can't be resized below. The Dashboard Properties, Dashboard Defaults and Dashboard Shift Lights windows can be closed by clicking on the X in the top right corner. The other windows cannot be closed. You can display any window by choosing it from the 'Windows' main menu.
-- DASHBOARD WINDOW
This is where your dashboard design is displayed. The dashboard is displayed here exactly as it will appear within the Z1 Dashboard. Resizing this window has the same effect as resizing the Z1 Dashboard. This allows you to see what your Dashboard will look like at different resolutions.
-- TOOL BAR WINDOW
This window displays all available tools. The pointer tool lets you select an object, move it, or resize it. To select an object simply click on it with the pointer. If multiple objects are located in the same place then the one which is 'on top' will be selected. Once an object is selected you can move it by clicking on it and dragging it to the desired location. You can resize a selected object by clicking and dragging on of the displayed resize handles. (To select objects that are underneath other objects, select that object's name in the Layers window.)
The other tools let you add various objects to your dashboard. If you hover the mouse over a tool its function will be displayed. The currently available objects to be added are: Rectangle, Rounded rectangle, Ellipse, Line, Multi-Line, Text, Data channel, Warning, Shift Light, Units, Graph, and Widget. Any newly created object will be placed in the currently active layer. (See the Layer Window section for more information.)
To add any object, select the tool, then click on the Dashboard where you want the object to appear and drag to the right and down to expand the size of the object. It does not matter if you get the size and placement exactly correct as you can move and resize the object at any time. The multi-line tool will add a new line segment every time you use the left mouse button. To end the multi-line object double click the mouse.
'Data Channel' - this displays a specific car data channel, such as gear, RPM, oil temp, etc. Note that data channels associated with user selectable units, like temperatures, will be displayed in the units specified by the user of the Z1 Dashboard when run in the Z1 Dashboard.
'Units' let you display certain units, such as temperature, in the units selected by the user of the Z1 Dashboard. So if you place a units object that is defined to show temperature, it will show 'C' if the user displays temperature in metric units, and 'F' if the user displays them in imperial units.
'Text' - This lets you define a rectangle within which you can display text. Once you create the text rectangle, use the Object Properties window to specify the text to be displayed.
'LED' - This lets you place an LED. There can be up to 15 shift light LEDs and 6 warning LEDs. Each LED can have its own On and Off colors. There is a checkbox within the Shift Lights Properties window that lets you turn the LED on or off to see what it looks like on both configurations. Note this setting has no effect on the Z1 Dashboard, it is only for designing purposes within the Z1 Designer.
'Graph' - This lets you display a data channel as a graph. This is useful for displaying rev counter bars, or brake bias bars, etc. You specify the direction the bar should move in (left to right, right to left, etc). You also specify the data channel associated with it and the minimum and maximum values for that channel.
A 'Warning' object lets you group objects together that are only displayed if the warning criteria is met. For example the pit limiter, or a high oil temperature. A warning object can contain any other type of object except another warning object.
'Widget' - This lets you display various items, or widgets, on your dashboard. Example of these are the lap time, delta time, lap counter, etc.
We suggest playing around with these various tools to see what they do.
-- LAYERS WINDOW
This displays all the objects contained on the background and foreground layers. You can use the scroll bar to move up or down the list if necessary. As mentioned before objects that never change can be placed in the background layer. Objects that could change should be placed in the foreground layer. To set the background as the active layer, click 'Background' in the layers window. To set the foreground as the active layer, click 'Foreground' in the layers window. The currently active layer will be highlighted and have the word 'active' displayed in its header. All new objects are placed on to the currently active layer (either background or foreground).
If you click on the name of an object in the layers window that object will become selected. This allows you to interact with, move and resize objects that are underneath other objects.
The checkboxes on the right side of the layers window allow you to toggle the display of an object on or off. This is intended to make designing your dashboard easier. You may have objects, such as warnings, that you do not need to see all the time when designing your dashboard. Or you may just want to temporarily hide some objects to make it easier to work with other objects. Note the hidden/visible status of an object has no effect on how it is displayed within the Z1 Dashboard.
-- OBJECT PROPERTIES WINDOW
This window displays the properties for the currently selected object in the Dashboard window. The display will change based on what type of object is selected. You can make changes to the currently selected object here as desired.
-- DASHBOARD PROPERTIES WINDOW
This window displays high level dashboard properties. You can change the dashboard's name, background color and preview image here. The preview image is what gets displayed in the Z1 Dashboard in the Car 2 tab when the user is selecting a dashboard.
-- DASHBOARD SHIFT LIGHTS WINDOW
This window displays the options for setting when the shift lights illuminate within your dashboard. If your dashboard does not contain shift lights then you can ignore this window. You can either enter specific RPMs for each shift light illumination, or select an option for them to be automatically turned on at certain RPM values. The drop down on the top right lets you choose this. (Note a user of your dashboard can always override these options. What you are entering here is just the default options for your dashboard's shift lights.)
All gears can use the same RPM shift values, or you can specify unique shift values for each gear. There is a checkbox at the top left that lets you toggle this feature on/off.
-- DASHBOARD DEFAULTS
This window shows various default values that are used when creating the dashboard. The end user on the Z1 Dashboard can adjust these values if they choose.
The Z1 Designer is a free application and can be downloaded here:
https://z1simwheel.com/dashboard/demo.cfm